Dashboard
The Cypress Dashboard is our enterprise-ready, web-based companion to the Cypress app. It gives you online access to your recorded test results, orchestrates test runs across multiple machines, provides rich analytics and diagnostics, and integrates those insights with your favorite tools.
Real World Example New
The Cypress Real World App (RWA) leverages the Cypress Dashboard in CI to test over 300 test cases in parallel across 25 machines, multiple browsers, multiple device sizes, and multiple operating systems.
Check out the Real World App Dashboard.
Benefits
Analyze and diagnose
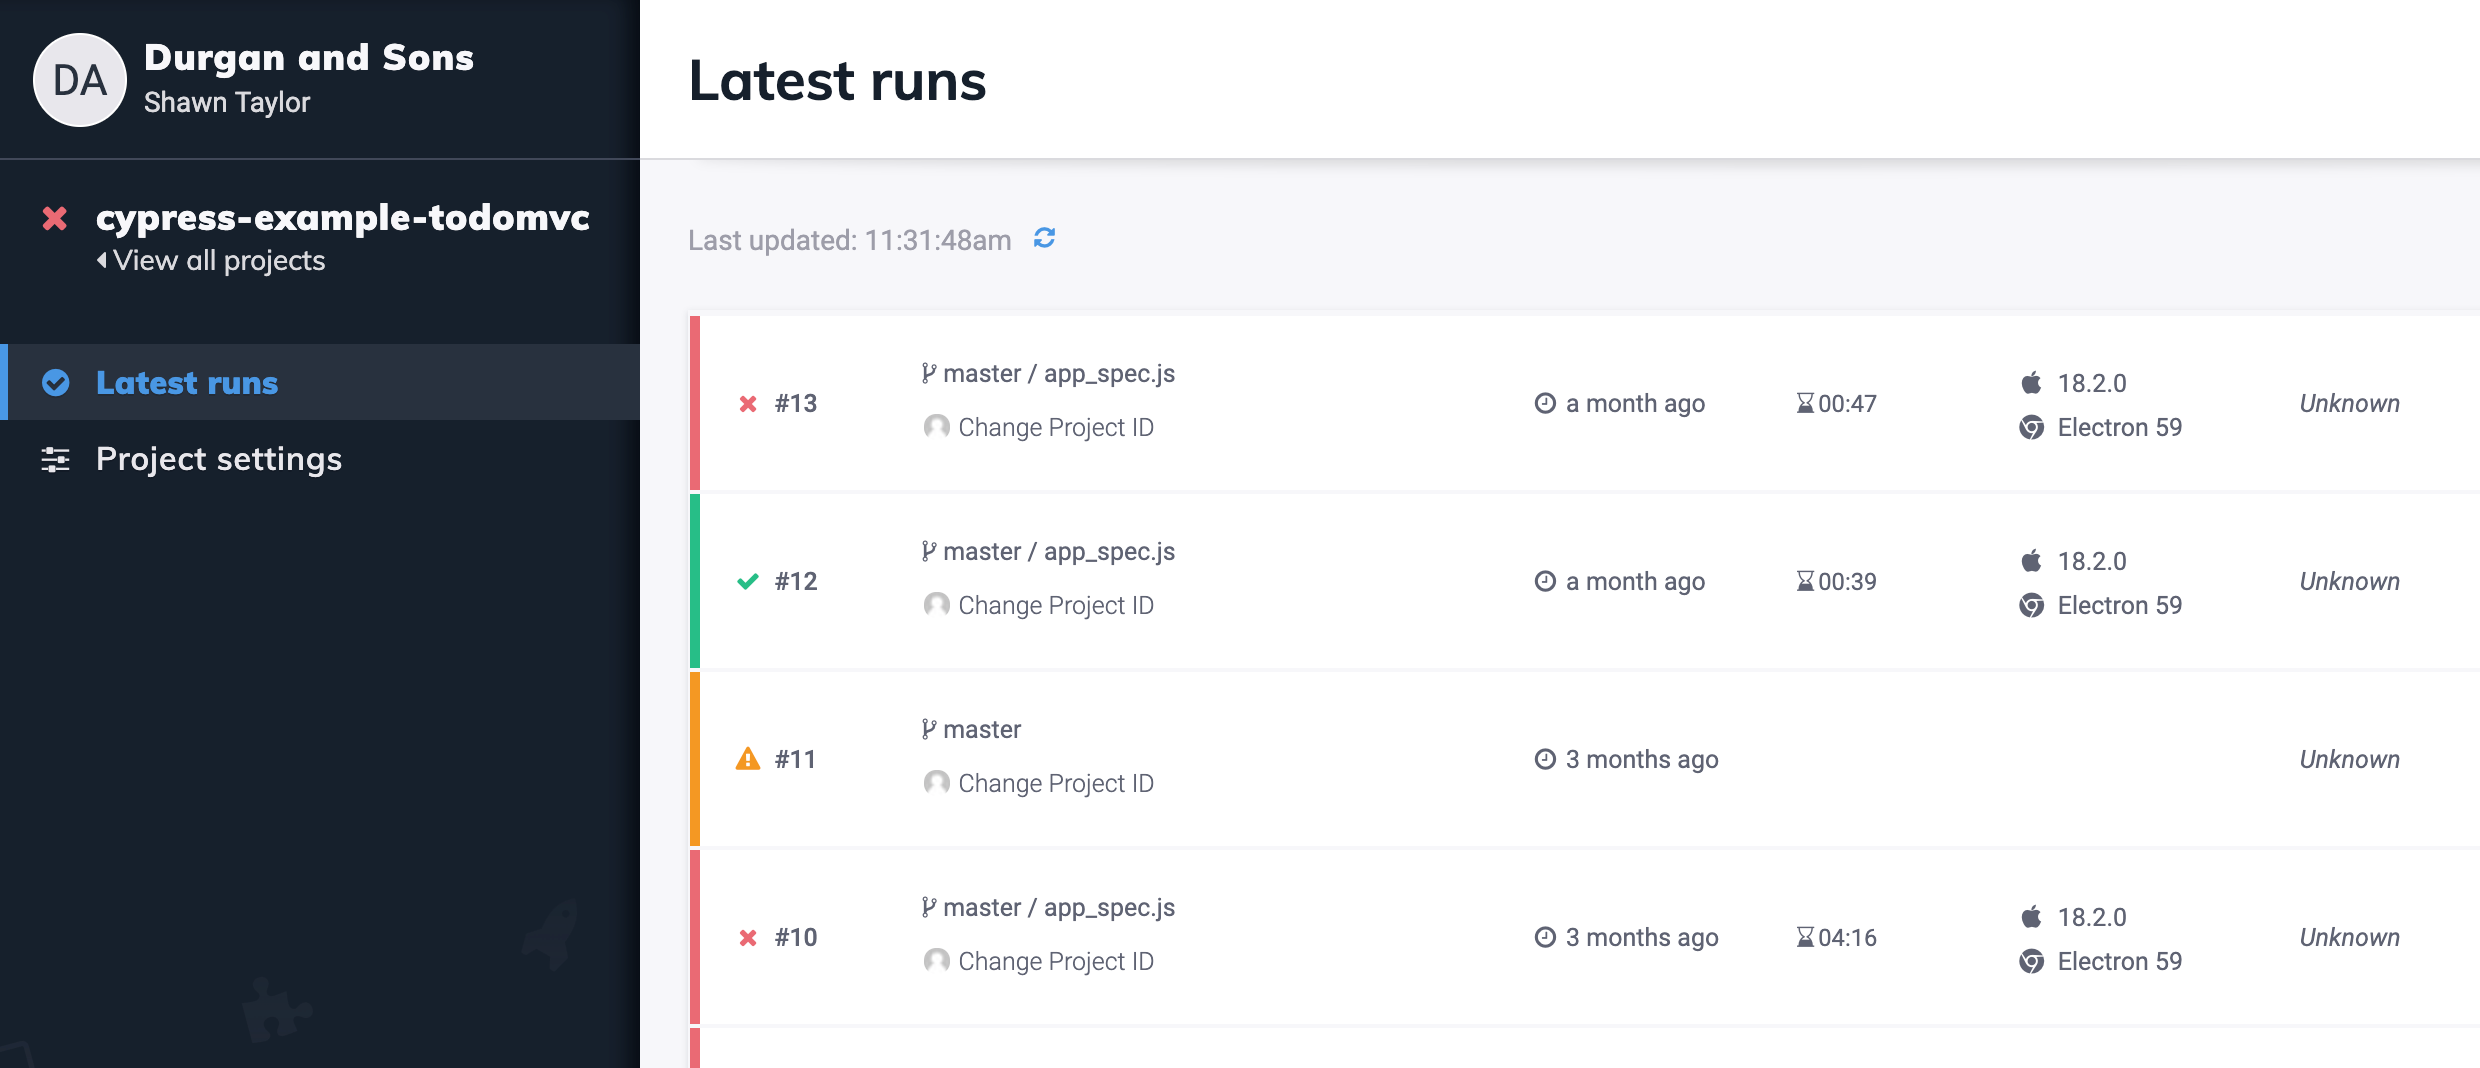
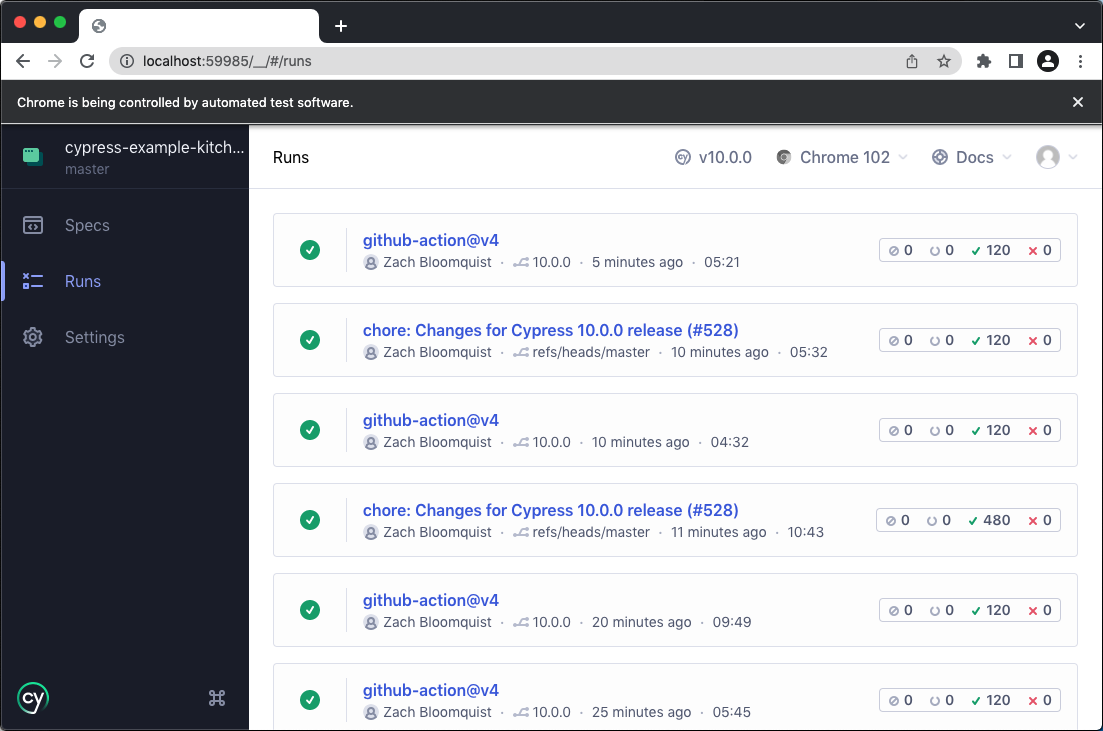
Store the full history of your test results, with video clips, screenshots, and full stack traces. Quickly see the current state of your app on the Latest Runs page, identify problematic trends with rich Analytics, and diagnose unreliable tests with Flaky Test Management. Associate related tests with grouping to see results broken down by browser and OS.
For users of the Cypress app, we've integrated test run information from the Dashboard with our interactive test-runner so developers can see the latest results across the team, and identify areas of concern.
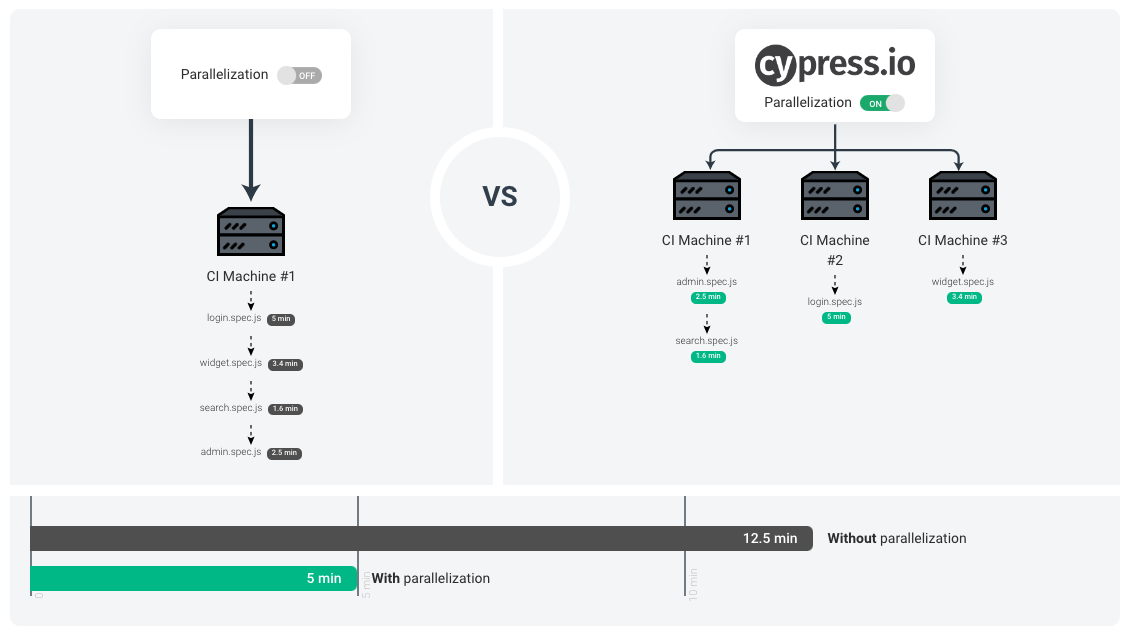
Run tests in parallel, in priority order, or not at all
With our Smart Orchestration features, you can run tests across a swarm of machines simultaneously while the Dashboard coordinates runners and balances test loads - no setup required! You can prioritize recently failed specs to surface problems earlier, and cancel whole test runs on failure to save on resource usage. You can also cancel in-progress runs manually from the Dashboard if you need to.
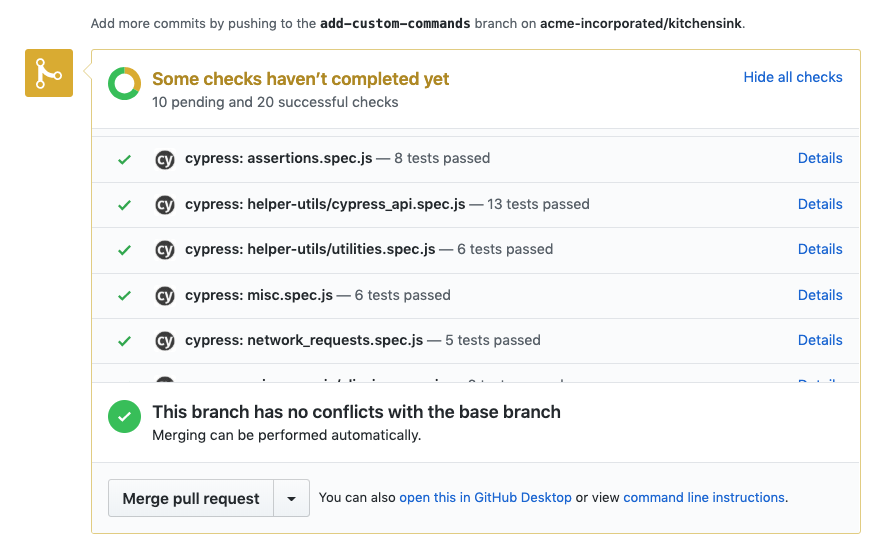
Integrate with source control providers
Ensure rock-solid reliability by keeping failing code out of your GitHub, GitLab and Bitbucket repositories, with status checks that block commits from being merged until your Cypress tests are green. Surface test results directly in your PRs with pull request comments that include test run statistics, specific failure details, and deep links to results in Dashboard for fast debugging. Dashboard users with Business or Enterprise plans can integrate securely with Self-managed GitLab instances too.
Collaborate and organize
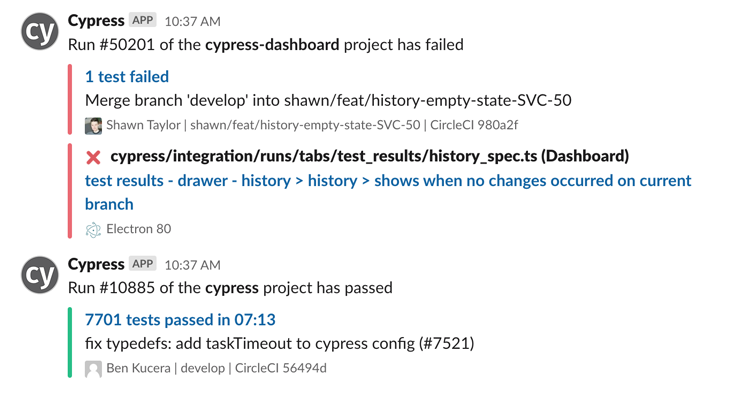
We also integrate with two of the world's most popular collaboration tools: Slack and Jira. Deliver test results with valuable additional context, directly into a dedicated Slack channel. Or for those on the Team, Business or Enterprise plans, create bidirectionally linked Jira tickets directly from specific test failures.
Lastly you can use our flexible adminstrative functions to configure the Dashboard however you want, grouping projects into multiple organizations if you have a lot, checking usage, and administering users and permissions. We also provide SSO integration for teams on our Enterprise plan.
Have a question you don't see answered here?
We have answered some common questions about the Dashboard Service in our FAQ.
Example projects
Once you log in to the Dashboard Service you can view any public project.
Here are some of our own public projects you can view: