Dashboard
- What is the Dashboard?
- How do I record my tests?
- How much does it cost?
- What counts as a test result?
- What counts as a user?
- What is the difference between public and private projects?
- How is this different than CI?
- Can I host the Dashboard data myself?
- Can I choose not to use the Dashboard?
- What is my Organization ID?
- What does Cypress record?
- Why is test parallelization based on spec files and not on the individual functions?
- My CI setup is based on Docker, but is very custom. How can I load balance my test runs?
- Can I delete a run from the Dashboard?
- Can I delete my Cypress account?
- What happens to my Dashboard if I downgrade my account?
- What happens once I reach the test results limit?
- I'm working at a restrictive VPN. Which subdomains do I have to allow on my VPN for the Dashboard to work properly?
What is the Dashboard?
The Dashboard is a Cypress service that gives you access to tests you've recorded - typically when running Cypress tests from your CI provider. The Dashboard provides you insight into what happened during your tests run.
You can read more here.
How do I record my tests?
- First set up the project to record.
- Then record your runs.
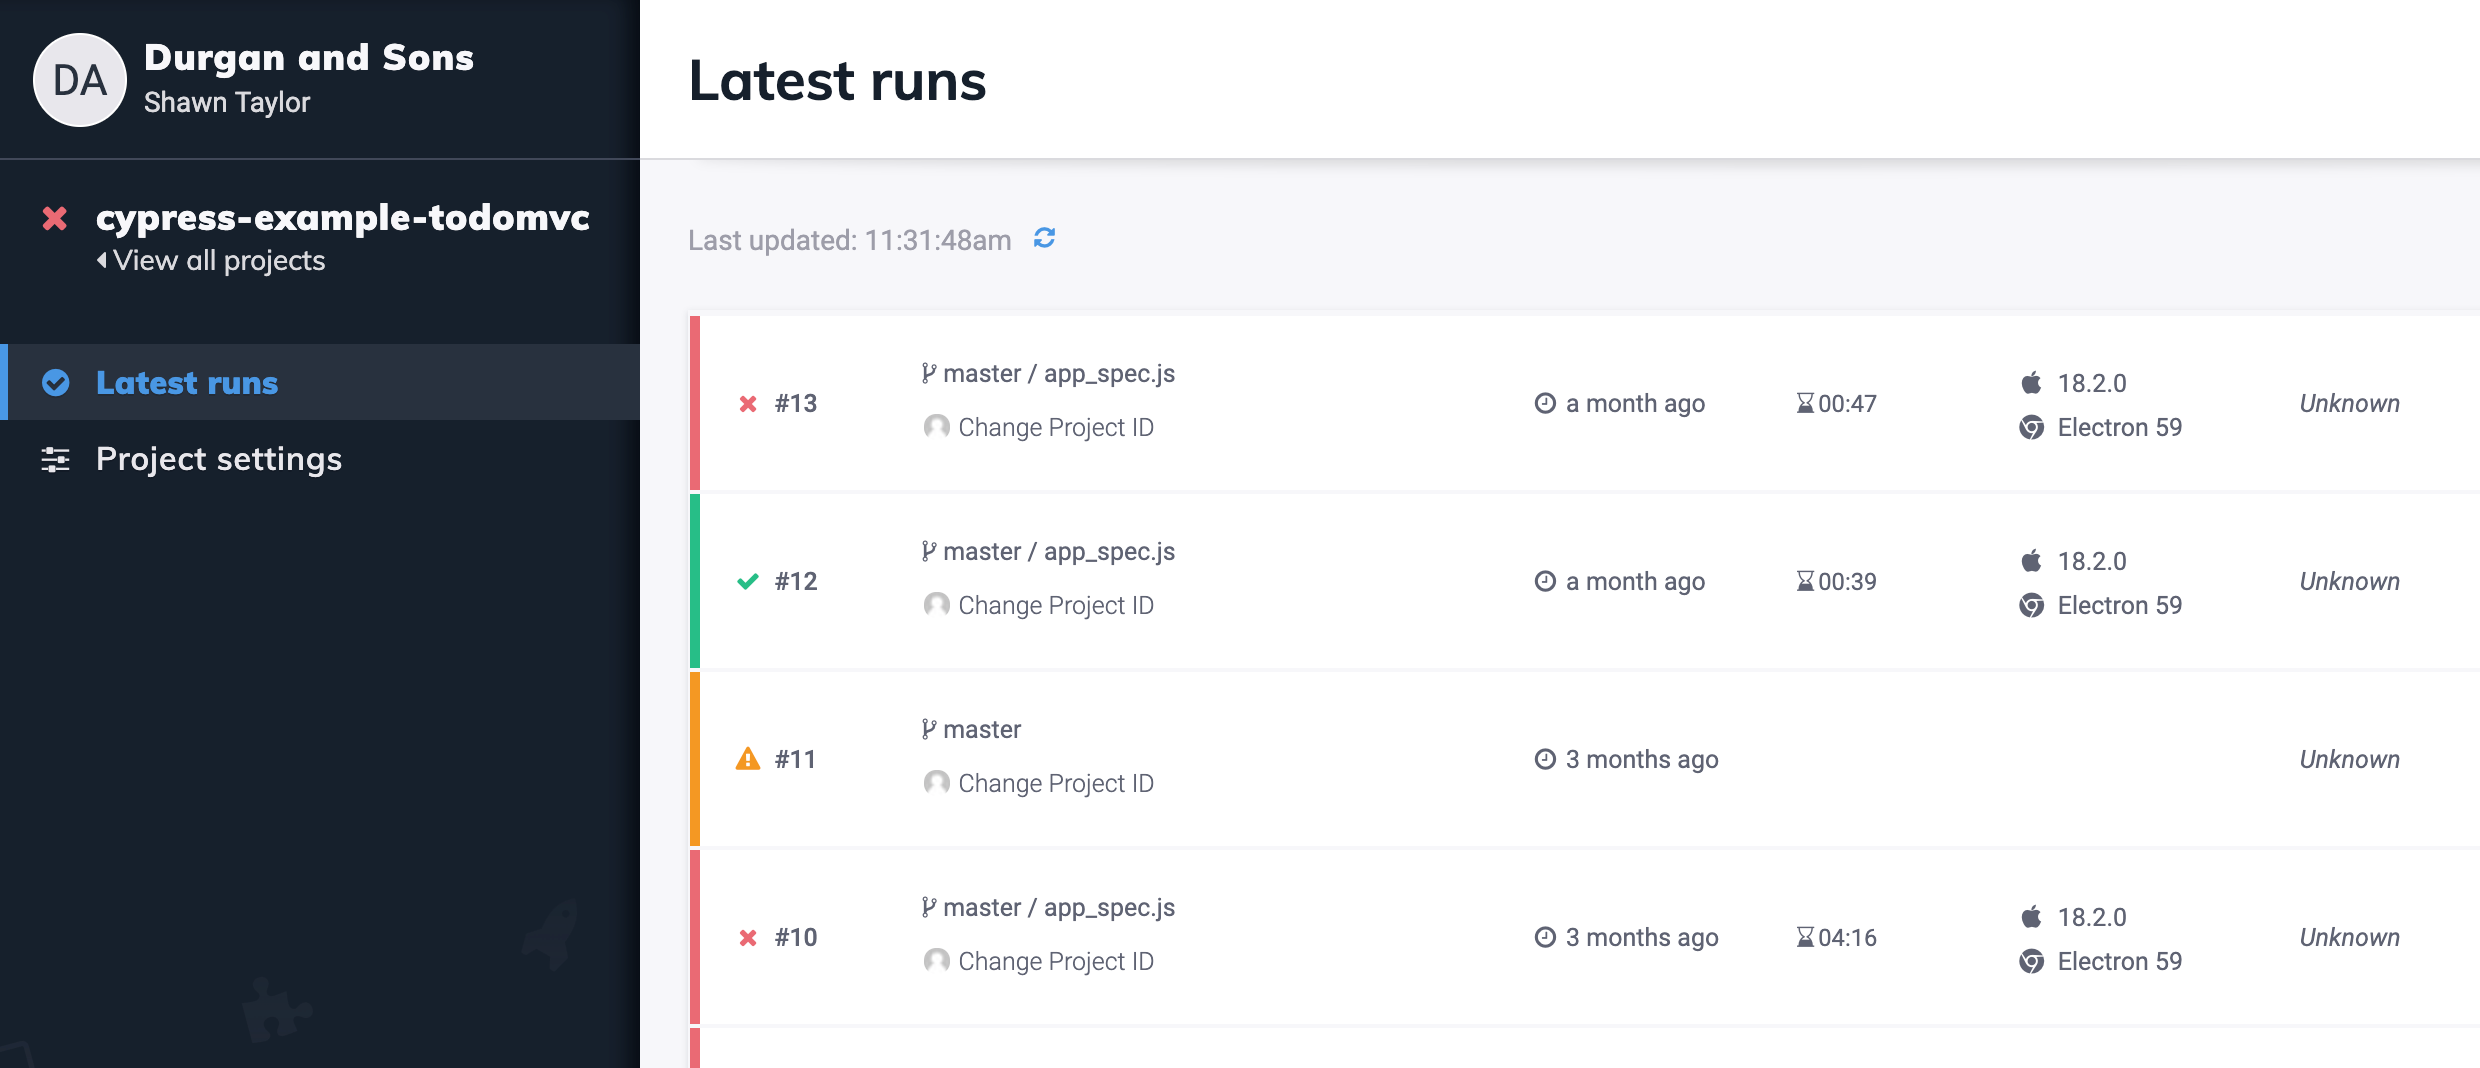
After recording your tests, you will see them in the Dashboard and in the "Runs" tab.
How much does it cost?
Please see our Pricing Page for more details.
What counts as a test result?
Which pricing tier is best for you depends on the number of test you record each month in your organization.
Tests are recorded when cypress run
is called with the --record flag while supplying the record --key. This
means your test run data is being "recorded" to the
Dashboard.
We consider each time the it() function is called to be a single test. So you
will generally have several tests recorded within each spec file and likely
several spec files within a single run. Only the
passed and failed tests
are counted. The pending and skipped tests are NOT counted.
You can always see how many tests you've recorded from your organization's Billing & Usage page within the Dashboard.
What counts as a user?
A user is anyone with a login to our Dashboard Service that has been invited to see and review the test results of your organization.
What is the difference between public and private projects?
A public project means that anyone can see the recorded runs for it. It's
similar to how public projects on Github, Travis, or Circle are handled. Anyone
who knows your projectId will be able to see the recorded runs, screenshots,
and videos for public projects.
A private project means that only users you
explicitly invite to your organization can
see its recorded runs. Even if someone knows your projectId, they will not
have access to your runs unless you have invited them.
How is this different than CI?
Cypress is complementary to your CI provider, and plays a completely different role.
It doesn't replace or change anything related to CI. You will run Cypress tests in your CI provider.
The difference between our Dashboard Service
and your CI provider is that your CI provider has no idea what is going on
inside of the Cypress process. It's programmed to know whether or not a process
failed - based on whether it had an exit code greater than 0.
Our Dashboard Service provides you with the low level details of what happened during your run. Using both your CI provider + Cypress together gives the insight required to debug your test runs.
When a run happens and a test fails - instead of going and inspecting your CI
provider's stdout output, you can log into the
Dashboard, see the stdout as well as
screenshots and video of the tests running. It should be instantly clear what
the problem was.
Can I host the Dashboard data myself?
No, although we are looking to build an on-premise version of the Dashboard for use in private clouds.
Can I choose not to use the Dashboard?
Of course. The Dashboard Service is a separate service from the Cypress app and will always remain optional. We hope you'll find a tremendous amount of value in it, but it is not coupled to being able to run your tests.
You can always run your tests in CI using
cypress run without the --record
flag which does not communicate with our external servers and will not record
any test results.
What is my Organization ID?
Your Organization ID is a unique identifier that is linked to your organization. Instructions on how to find your ID are in the Dashboard Guide.
What does Cypress record?
We capture the following:
- Standard Output
- Test Failures
- Screenshots
- Video
We have already begun the implementation for capturing even more things from your run such as:
- Commands
- Network Traffic
- Browser Console Logs
These will be added in subsequent releases.
Why is test parallelization based on spec files and not on the individual functions?
Cypress test parallelization is indeed based on specs. For each spec Cypress scaffolds the new running context, in a sense isolating each spec file from any previous spec files, and ensuring a clean slate for the next spec. Doing this for each individual test would be very very expensive and would slow down the test runs significantly.
Spec file durations are also more meaningful and consistent than timings of individual tests, we can order specs by the moving average of the previously recorded durations. This would be much less useful when load balancing quickly finishes individual tests.
Thus, to better load balance the specs, you would want more spec files with approximately the same running duration. Otherwise, a single very long running test might limit how fast all your tests finish, and how fast the run completes. Due to starting a new test execution context before each spec file and encoding and uploading video after, making spec files run shorter than approximately 10 seconds would also be fruitless - because Cypress overhead would eat any time savings.
My CI setup is based on Docker, but is very custom. How can I load balance my test runs?
Even if your CI setup is very different from the
CI examples we have and
run with our sample projects,
you can still take advantage of the test load balancing using the Dashboard.
Find a variable across your containers that is the same for all of them, but is
different from run to run. For example it could be an environment variable
called CI_RUN_ID that you set when creating the containers to run Cypress. You
can pass this variable via CLI argument
--ci-build-idwhen
starting Cypress in each container:
cypress run --record --parallel --ci-build-id $CI_RUN_ID
For reference, here are the variables we extract from the popular CI providers, and for most of them there is some variable that is set to the same value across multiple containers running in parallel. If there is NO common variable, try using the commit SHA string. Assuming you do not run the same tests more than once against the same commit, it might be good enough for the job.
Can I delete a run from the Dashboard?
You can archive a run so that it does not display in the runs list or in analytics.
Note: Archiving the recorded runs has no effect on the amount of tests recorded and counted as your usage billed for the month.
Can I delete my Cypress account?
You can delete your Cypress account from your Dashboard profile. Deleting your account cannot be undone! By deleting your Cypress account, all associated data in your account will be permanently deleted.
What happens to my Dashboard if I downgrade my account?
Downgrading your account will not result in loss of access to your Dashboard.
However, it will make your Dashboard subject to the limitations of your new plan. For example, downgrading to the Seed plan will limit data retention to 30 days and test results to 500 per billing period.
What happens once I reach the test results limit?
Tests running with the --record flag will run as normal when the limit is
reached, but parallelization will be disabled and new test results will be
hidden from the dashboard until your plan is upgraded or a new usage cycle
begins. The usage cycle resets each month.
In order to avoid any interruption in service, we recommend that you review your usage and select a plan that satisfies your usage requirements. You can do this by:
- Logging into the Dashboard
- Select your organization
- Navigate to the Billing and Usage tab
- Review your organization's usage
- Scroll down and select Upgrade under your plan of choice
I'm working at a restrictive VPN. Which subdomains do I have to allow on my VPN for the Dashboard to work properly?
To send the data and results of your tests to the Dashboard, Cypress needs free access to some URLs.
If you are running the tests from within a restrictive VPN you will need to allow some URLs so that Cypress can have effective communication with the Dashboard.
The URLs are the following:
https://api.cypress.io- Cypress APIhttps://assets.cypress.io- Asset CDN (Org logos, icons, videos, screenshots, etc.)https://authenticate.cypress.io- Authentication APIhttps://dashboard.cypress.io- Dashboard apphttps://docs.cypress.io- Cypress documentationhttps://download.cypress.io- CDN download of Cypress binaryhttps://on.cypress.io- URL shortener for link redirects